One of the new emerging technologies I am using in both the tech grant I work on and math classes that I teach is Tableau Public. It is a data visualization software built primarily for business, but now being used by bloggers worldwide to add interactive visualizations of data to their blogs. A friend of mine works there and is specifically working on an Ipad application of the software. So with that said, I decided to embed a vis in my blog to see how it looks on the Ipad.
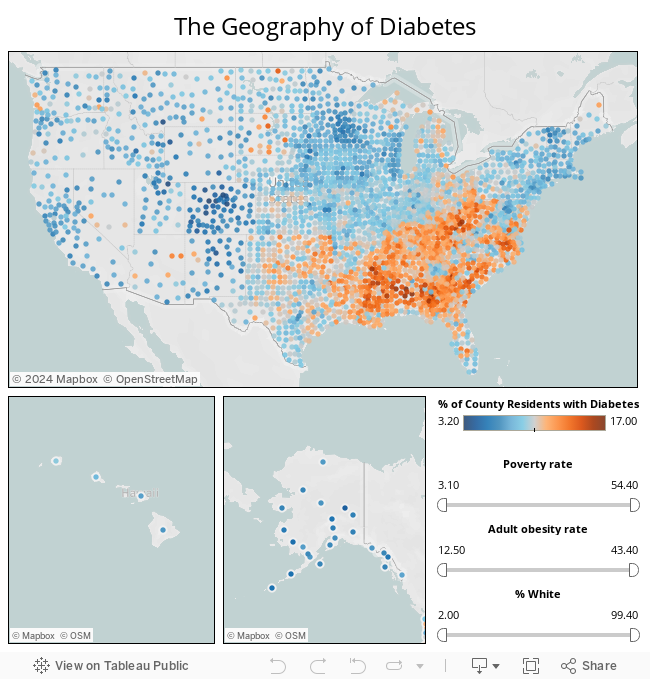
This vis was created by Annette Greiner using the USDA's Activity Rates and Health Living Data Set. It gives a picture of the Geography of Diabetes:
Robin - Is this the blog post you wanted us to test? Sorry, I can't remember what you wanted us to look at.
ReplyDelete